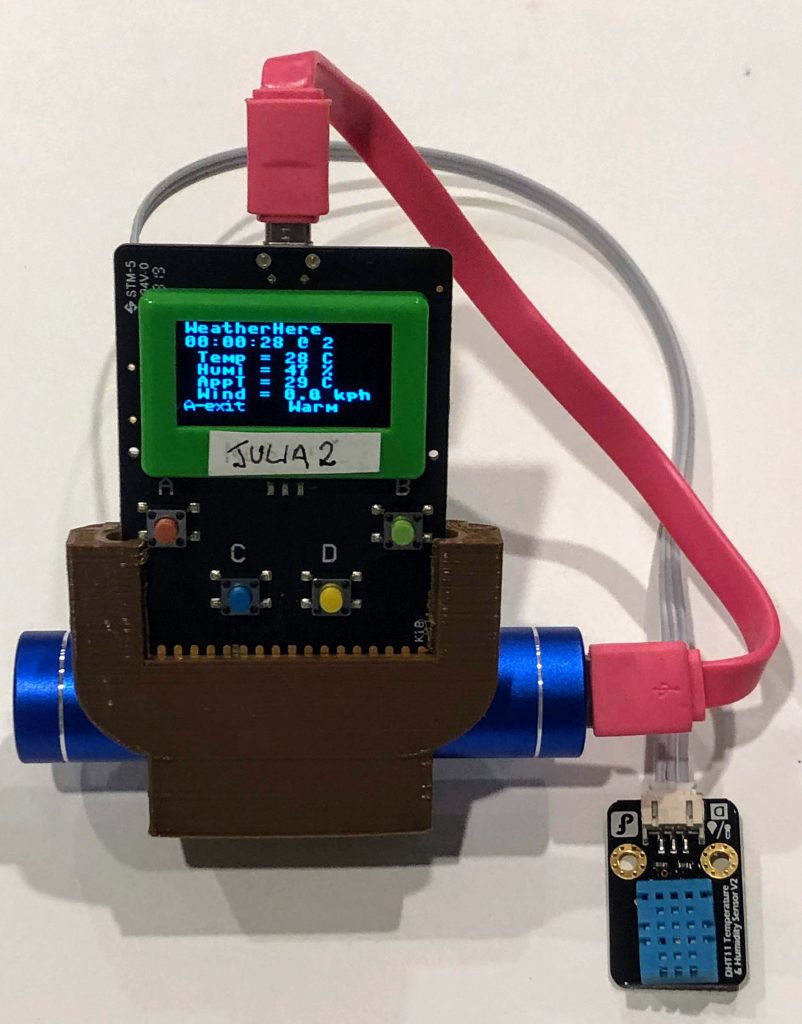
The Kookaberry uses very low-cost plug-in sensors to measure and store a multitude of environmental and other factors inside and outside of the classroom. It runs pre-coded programmes which can be created or customised as required.
This tutorial demonstrates how to measure temperature and relative humidity, and display them on the Kookaberry's screen together with the calculated apparent temperature.
Step 1
Connect a DHT11 combined Temperature/Relative Humidity (T/RH) sensor to one end of a 3-wire jst connecting lead and plug the other end into the P2 connector on the back of the Kookaberry.
Scroll down the menu to the WeatherHere app and press the green button B to run.
It will take a few seconds to appear….

Step 2
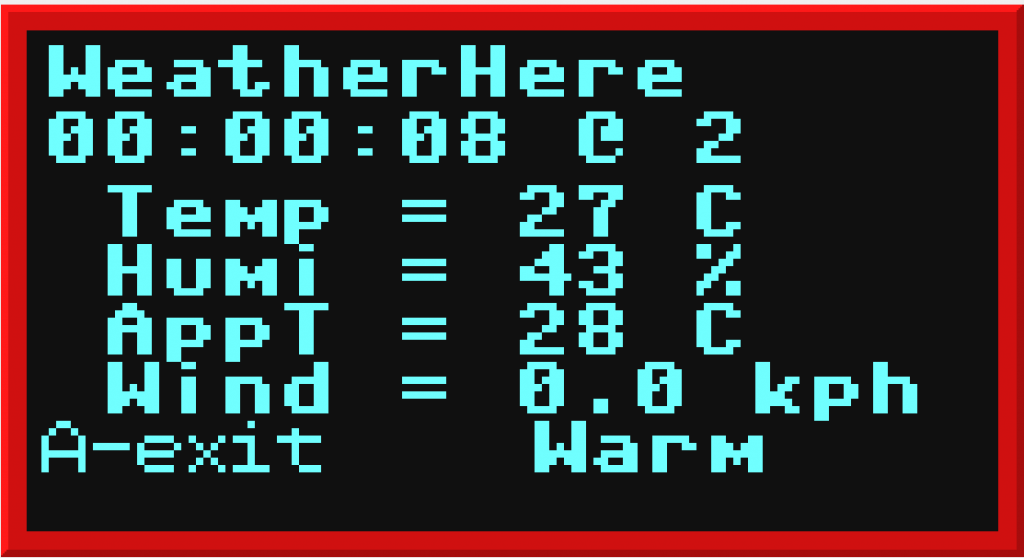
The Temp value is the measured temperature and Humi the measured percentage humidity.
The App T is the apparent temperature calculated according the Bureau of Meteorology’s algorithm. It measures the temperature you are actually experiencing when humidity is taken into account.
The Wind value is for when an anemometer is connected

What is on the screen
The digital readout underneath the title on the screen is the duration of the data logging operation and the sampling interval is the last figure in seconds.
Both the duration and the sampling interval (in this case every 2 seconds) can be edited in the Kappconfig file in the Kookaberry’s USB root memory (see Quick Manual).

