
This app records the surface temperature of any object to which an infra-red sensor is pointed, as well as the sensor’s ambient temperature.
Temperature readings are taken at the chosen INTERVAL configuration parameter (see the _Config app), are graphed in real-time on trends on the Kookaberry display, and recorded in the STELR_IRT.CSV file for subsequent analysis and presentation by a spreadsheet program and/or database, or by the built-in GraphCSV app.
Directions
Step 1: Setting up
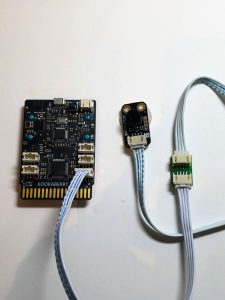
This App requires the non-contact IR Temperature sensor to be plugged into Pin 3 on the Kookaberry using two 4-wire jst cables with the Pin swap module connected inline as shown below.
See also the SeeTemp App for making one-off spot temperature readings.
Step2: Finding the app
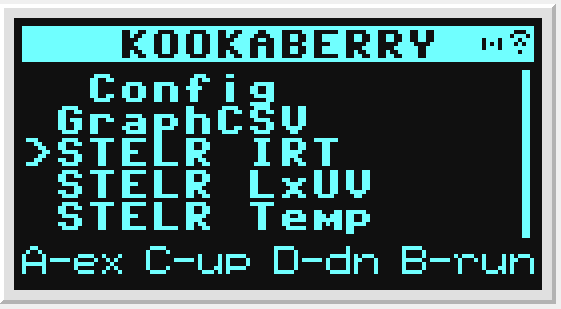
Navigate to cursor to the STELR_IRT app by repeatedly pressing button D, as shown in the picture, and press button B to run the app.
Step 3: Running the app
What is showing on the screen?
-
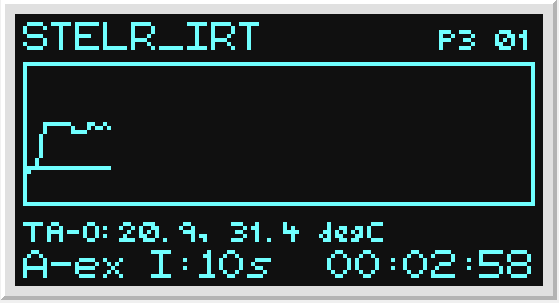
Top: The name of the app “STELR_IRT” followed by the plug on the rear of the Kookaberry used by the temperature probes (P3) and the ID of the Kookaberry (01)
-
Middle: The trend display area for the real-time temperature measurements. The trend lines will proceed from left to right, then the trend will scroll to the left. One hundred readings per measure have been allowed for on the display.
-
Next: The numerical values of the latest ambient (TA) and object (TO) temperature readings in degrees Centigrade.
-
Bottom: The last line shows that button A exits the app, that the sampling interval (I:) is 10 seconds, and the elapsed measurement time period (hh:mm:ss) is 02 mins and 58 seconds.
Step 4: Using the app
 Run the STELR_IRT app as long as is necessary to capture the experimental data. When ready press button A to exit the app and return to the Kookaberry app menu.
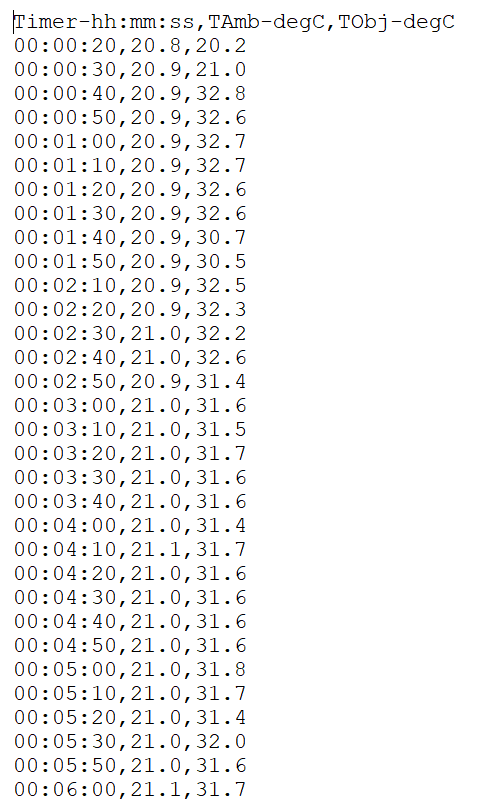
The measurement data should be recorded in the STELR_IRT.CSV file in the Kookaberry’s file store. The file is actually a text file with contents as in the image.
The data can be retrieved by (re)tethering the Kookaberry to a computer where the file store will appear as a USB memory stick. Copy the STELR_IRT.CSV file to the computer for analysis using a spreadsheet program such as Excel.
It is also possible to use the Kookaberry’s GraphCSV app to convert the CSV file into a web browser viewable graph.