
This app simultaneously records the readings from a Luxmeter and a UV sensor. The purpose of this app is to record the incident and transmitted light levels through various transparent and translucent housing materials, for example in windows, doors, skylights and awnings.
Light readings are taken manually only when button B on the Kookaberry is pressed. This method facilitates the interchange of housing panels between readings and the comparison of data between readings.
The readings are plotted as they are taken on two separate trend displays, and are also recorded in the STELR_LxUV.CSV data logging file.
Learn about the measurement of visible light and the UV index from the links in the Resources section at the bottom of this page
Directions
Step 1: Setting up
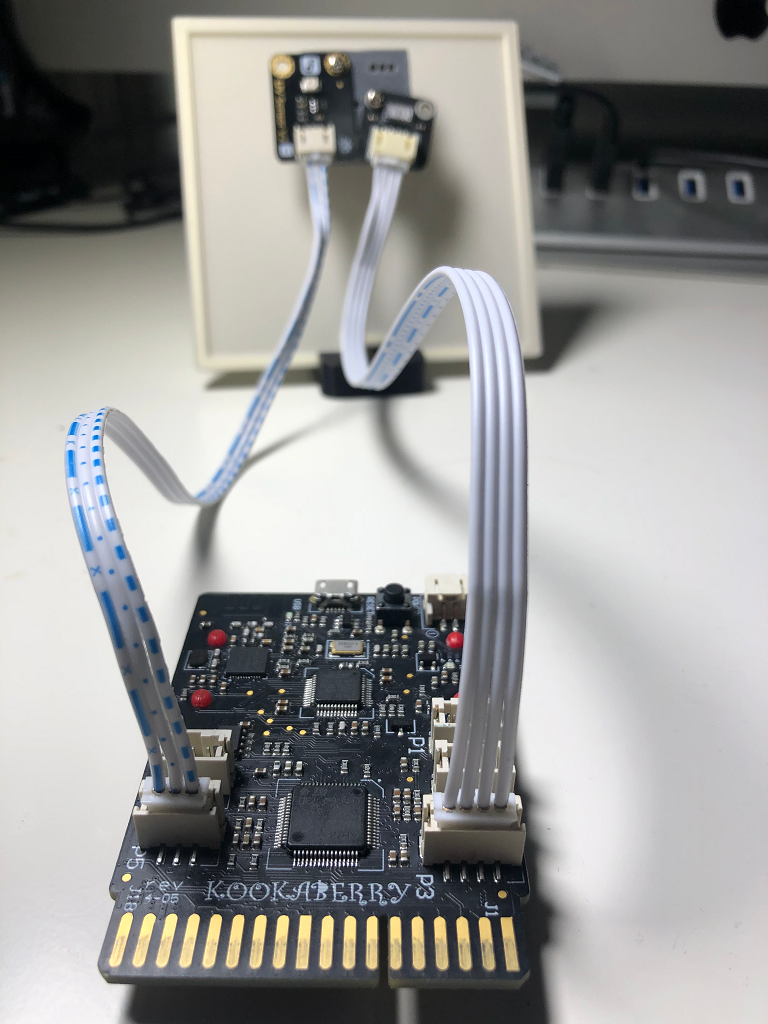
First connect the light sensors to the Kookaberry plugs P3 and P4 as shown.
The sensors should be mounted side by side on a sensor mount attached to a wall panel as shown in the background.
The UV sensor uses a 3 conductor cable and connector and plugs into plug P5 on the Kookaberry. It provides UV Index measurements from the light incident on the sensor.
The Luxmeter uses a 4 conductor cable and connector which plugs into plug P3 on the Kookaberry. It measures the intensity of visible light incident on the sensor in Lux.
The cables can be routed via a small indent at the base of the housing panel to get them from the inside to the outside of a house model.
Place the sensors either in the floor or wall of a house model (or a real house) in line with the housing panel whose properties will be measured and so that the light source (the sun is best) will illuminate the sensors through the subject panel. The house panel stand can be used in lieu of the house model frame to hold the panel vertically or at 60 degrees’ tilt.
Step 2: Finding the app
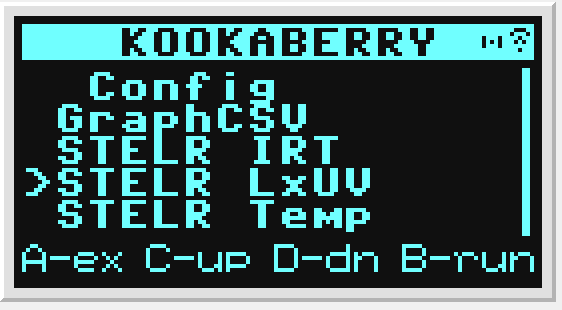
Navigate to cursor to the STELR_LxUV app by repeatedly pressing button D, as shown in the picture, and press button B to run the app.
Step 3: Running the app
What is showing on the screen?
-
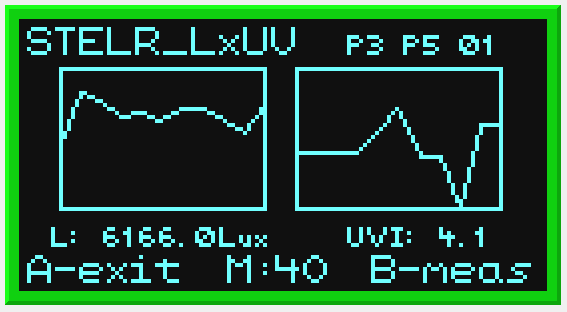
Top: The name of the app “STELR_LxUV” followed by the plugs on the rear of the Kookaberry used by the temperature probes (P3 and P5) and the ID of the Kookaberry (01)
-
Middle: The trend display areas for the real-time light measurements. The trend on the left is for visible light illuminance, and the trend on the right is for UV Index. The trend lines will proceed from left to right, then the trend will scroll to the left. Six readings per probe have been allowed for on the display. The vertical axes for both graphs are scaled logarithmically as visible light readings can vary over a large range, and the UV Index can be shown from 0.1 up to 10 (although the theoretical and dangerous maximum is over 11).
-
Next: The trend display area, the numerical values of the latest sensor readings.
-
Bottom: The last line shows that button A exits the app, that the number of measurements taken (M:) is 40 (in this example), and that pressing button B causes another measurement to be taken.
Step 4: Using the app
 Take as many measurements with the STELR_LxUV app as are necessary to capture the experimental data. When ready press button A to exit the app and return to the Kookaberry app menu.
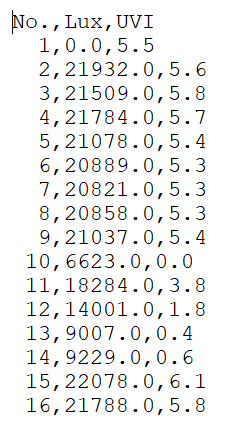
The measurement data should be recorded in the STELR_LxUV.CSV file in the Kookaberry’s file store. The file is actually a text file with contents as in the image.
The data can be retrieved by (re)tethering the Kookaberry to a computer where the file store will appear as a USB memory stick. Copy the STELR_LxUV.CSV file to the computer for analysis using a spreadsheet program such as Excel.
It is also possible to use the Kookaberry’s GraphCSV app to convert the CSV file into a web browser viewable graph.